


Genome Statistics
Genome General Information
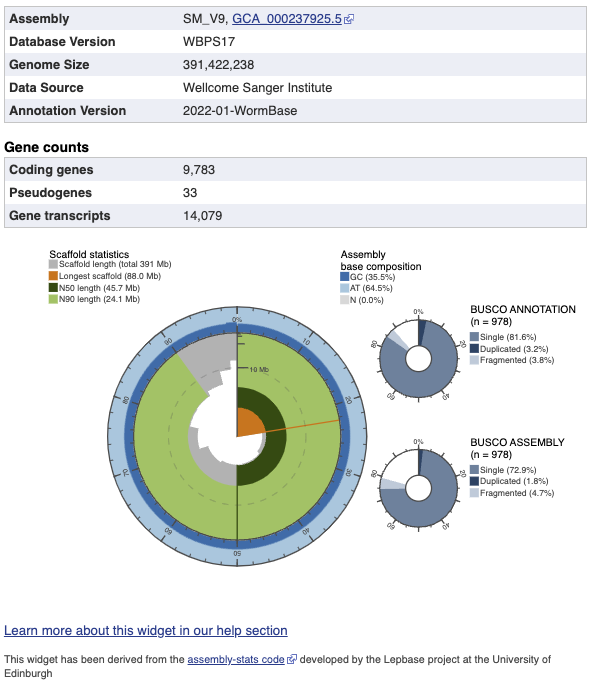
Some general information and statistics are displayed for the assembly/annotation of the genome.
Scaffold Statistics Widget
The circumference of the widget represents the full length of the genome, from 0% to 100%, with the scaffolds sorted into descending order based on length. The radius of the silver area represents the scaffold length at this point in the descending list. The length of the longest scaffold within the assembly is shown in orange.
Dark green = N50 length. This is length of the smallest contig such as the sum of the sequences larger than this contig covers half of the genome assembly.
Light green = N90 length. This is length of the smallest contig such as the sum of the sequences larger than this contig covering 90% of the genome assembly.
Hovering over the widget will reveal the N-value at this point. For example, hovering over 30% will display the N30 value.
The exterior of the circle shows the AT:GC:N content ratio within each scaffold at that point of the genome.
BUSCO ANNOTATION Piechart
BUSCO ANNOTATION (--mode proteins) is running at the protein level, assessing not only the assembly quality of a genome but also the quality of its annotation. In the genome annotation, we look for single-copy orthologues that are present in more than 90% of animals. The percentages of complete (duplicated and single) and fragmented genes recovered are reported.
BUSCO ASSEMBLY Piechart
BUSCO ASSEMBLY (--mode genome) does not take account the genome's provided gene models, assessing the assembly quality of a genome. It initially runs AUGUSTUS on the genome's assembly, to predict a gene-set. In the AUGUSTUS predicted gene-set for the genome assembly, we look for single-copy orthologues that are present in more than 90% of animals. The percentages of complete (duplicated and single) and fragmented genes recovered are reported.
BUSCO Metrics Calculation
BUSCO v3 is used to compute these metrics.
Additionally, we use a different database for assessing nematodes and platyhelminths: Nematode assemblies use nematoda_odb9 for BUSCO analysis, Platyhelminth assemblies use metazoa_odb9 for BUSCO analysis.

