

Variant Effect Predictor (VEP)
The Variant Effect Predictor (VEP) determines the effect of your variants (SNPs, insertions, deletions, CNVs or structural variants) on genes, transcripts, and protein sequence, as well as regulatory regions through a simple point-and-click interface. Simply input the coordinates of your variants and the nucleotide changes to find out the:
- genes and transcripts affected by the variants
- location of the variants (e.g. upstream of a transcript, in coding sequence, in non-coding RNA, in regulatory regions)
- consequence of your variants on the protein sequence (e.g. stop gained, missense, stop lost, frameshift)
- known variants that match yours
The WormBase VEP is built using Ensembl technology. For a more detailed description of the VEP tool, see the Ensembl documentation.
If you use the VEP in your work, please cite McLaren et. al. (doi:10.1093/bioinformatics/btq330)
Data input
When you reach the VEP web interface, you will be presented with a form to enter your data and alter various options.
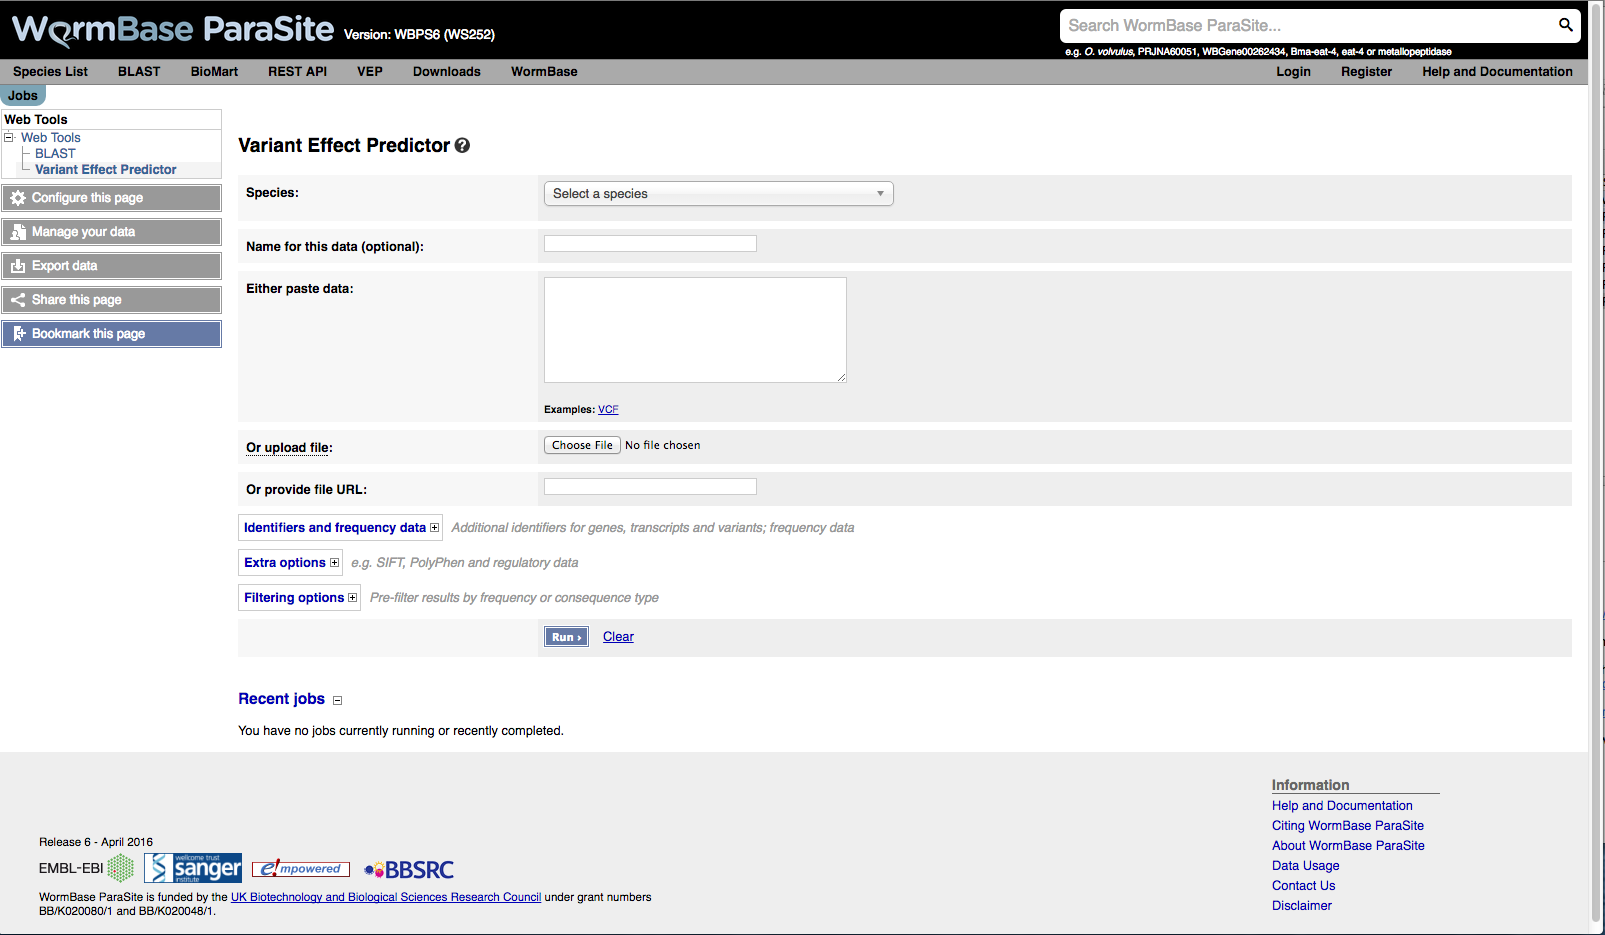
- First select the correct species for your data. Start typing into the box to get an autocomplete list of species
- You can optionally choose a name for the data you upload - this can make it easier for you to identify jobs and files that you have uploaded to the VEP at a later point.
-
You have three options for uploading your data:
- File upload - click the "Choose file" button and locate the file on your system
- Paste file - simply copy and paste the contents of your file into the large text box
- File URL - point the VEP to a file hosted on a publically accessible address. This can be either a http:// or ftp:// address.
The format of your data is automatically detected. For a description of the accepted input formats see the Ensembl VEP documentation.
- For pasted data you can get an instant preview of the results of your first variant by clicking the button that appears when you paste your data. This quickly shows you the consequence type, the IDs of any overlapping variants, genes, transcripts and regulatory features. To see the full results set submit your job as normal.
Identifiers
The VEP can provide additional identifiers for genes, transcripts, proteins and variants.
- Gene symbol - add the gene symbol for the gene to the output.
- CCDS - add the Consensus CDS transcript identifier where available.
- Protein - add the WormBase ParaSite protein identifer.
- Uniprot - add identifiers for translated protein products from three UniProt-related databases (SWISSPROT, TREMBL and UniParc).
Extra options
- Transcript biotype - add the transcript biotype to the output.
- Protein domains - report protein domains from Pfam, Prosite and InterPro that overlap input variants.
- Exon and intron numbers - report the exon or intron number that a variant falls in as NUMBER / TOTAL, i.e. exon 2/5 means the variant falls in the 2nd of 5 exons in the transcript.
- Transcript support level - report the transcript support level of the overlapped transcript.
- APPRIS - APPRIS is a system to annotate alternatively spliced transcripts based on a range of computational methods.
- Identify canonical transcripts - adds a flag to the output indicating if the reported transcript is the canonical transcript for the gene.
Filtering options
The VEP allows you to pre-filter your results. Note that it is also possible to perform equivalent operations on the results page for the VEP.
- Return results for variants in coding regions only - exclude variants that don't fall in a coding region of a transcript.
- Restrict results - for many variants the VEP will
report multiple consequence types - typically this is because
the variant overlaps more than one transcript. For each of these
options the VEP uses consequence ranks that are subjectively
determined by Ensembl. Note that enabling one of these
options not only loses potentially relevant data, but in some
cases may be scientifically misleading. Options:
- Show one selected consequence - pick one consequence type across all those predicted for the variant; the output will include transcript- or feature-specific information. Consequences are chosen by the canonical, biotype status and length of the transcript, along with the ranking of the consequence type according to this table. This is the best method to use if you are interested only in one consequence per variant.
- Show one selected consequence per gene - pick one consequence type for each gene using the same criteria as above. Note that if a variant overlaps more than one gene, output for each gene will be reported.
- Show only list of consequences per variant - give a comma-separated list of all observed consequence types for each variant. No transcript-specific or gene-specific output will be given.
- Show most severe per variant - only the most severe of all observed consequence types is reported for each variant. No transcript-specific or gene-specific output will be given.
Jobs
Once you have clicked "Run", your input will be checked and submitted to the VEP as a job. All jobs associated with your session or account are shown in the "Recent Tickets" table. You may submit multiple jobs simultaneously.
The "Jobs" column of the table shows the current status of the job.
- Queued - your job is waiting to be submitted to the system
- Running - your job is currently running
- Done - your job is finished - click the [View results] link to be taken to the results page
- Failed - there is a problem with your job - click the magnifying glass icon to see more details
You may delete a job by clicking the trash can icon. If you are logged in to your account, you can save the job by clicking the save icon.
You may also resubmit a job (for example, to re-run with the same data but change some parameters) by clicking the edit icon.
You can see a summary of the options that you selected for your VEP job by clicking on the magnifying glass icon.
Results
The VEP presents a summary and a detailed results preview on its results page.
Summary
The summary panel on the VEP results page gives a brief overview of the VEP job, along with some basic statistics about the results.
Statistics
Various statistics are listed in a table, including:
- Variants processed - any variants not parsed by the VEP are not included in this count
- Variants remaining after filtering
- Novel / known variants - the number and percentage of novel variants vs existing variants in the input (see input page documentation)
- Number of overlapped genes, transcripts and regulatory features
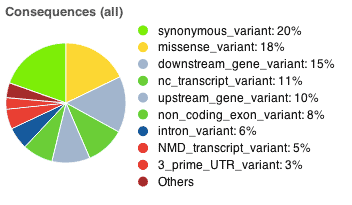
Pie charts
Pie charts are shown detailing the proportion of consequence types called across all variants in the results. The colour scheme of the pie chart matches the colours used to draw variants on the Ensembl region in detail view.
Results preview table
The results table shows one row per transcript and variant. By default all of the columns are shown; to temporarily hide columns, click the blue "Show/hide columns" button and select or deselect the columns you wish to view. The columns you select will be recalled when viewing other jobs.
Hover over a column title to see a description. See the Ensembl VEP documentation for more details on each of the results columns.
The table can be sorted by any column - click the column header to toggle sorting behaviour.
To download what you see in the table, hover over the spreadsheet icon in the top right corner of the table.
Several columns have special features for the data they contain:
- Location - click the link to navigate to the region in detail view for the region surrounding this variant
- Gene, Feature and Existing Variation - click the link to bring up a summary view of the gene, transcript, regulatory feature or variation, from which you can navigate to the main Ensembl page for it
- Consequence - hover over the consequence name to see the Sequence Ontology definition. See the Ensembl Variation documentation for a full list of consequence types used by the VEP and their definitions
Navigating results
The navigation panel can be used to scroll through pages of results.
By default, the results for five variants are shown. Note that since a variant can overlap multiple transcripts, the table will often show more than five rows. To change the number shown, click the appropriate link. Be warned that if your input file is large, it is inadvisable to show all results unless you are sure you have applied sufficient filters - your browser may become unresponsive if it tries to display many thousands of rows in the table.
To navigate between pages of results, use the four arrow icons. Note that when any filters are enabled, it is not possible to navigate to the last page of results as the total number of results cannot be calculated.
Filtering results
You can apply any combination of filters to your results in order to identify interesting data.
To add a filter, simply select the column you wish to filter on, select an "operator", and input a value for the filter to compare to.
To edit a filter, click the pencil icon. To remove a filter, click the cross icon.
When you have added more than one filter, you are given the option to match any or all of the rules shown; click the "Update" button once you have made your selection.
Certain columns when selected have special features:
Location - for this column you may enter genomic coordinates in the format "chromosome:start-end".
Adding multiple location filters allows you to select multiple regions - location filters are not affected by whether you select "Match all" or "Match any" (see above).
Users should note that enabling at least one location filter will greatly speed up the return of results (this is because tabix is used behind the scenes).
Location filters are not affected by the operator selected.
- Allele, Feature type, Consequence and Biotype - for these columns, autocomplete will help you fill in the value when you start typing
Downloading results
The VEP allows you to download either your full or filtered results set in a choice of data formats.
- VCF - VCF is a portable format for variant data. Consequence data is encoded as a series of delimited strings under the "CSQ" key in the VCF INFO field.
- VEP - The default VEP output format gives one row per variant and transcript overlap.
- TXT - Text format is a tab-delimited format, equivalent to what can be seen in the results table. Note that the columns you select to be visible in the table do not affect the downloaded file - all columns are outputted. This format is best if you intend to import the results into a spreadsheet program such as Microsoft Excel.
You can also send the genes or known variants in your current preview to BioMart. This allows you to easily retrieve any of BioMart's rich data associated with these genes (other database references, GO terms, orthologues/paralogues) and variants (phenotype annotations, synonyms, citations).

